Chapter 4. The Network Viewer
Table of Contents
- 4. The Network Viewer
-
- 4.1. What is the Network Viewer?
- 4.2. Compiling
- 4.3. Opening as an Application
- 4.4. Opening as an Applet
- 4.5. Controlling the View
- 4.6. Controlling the Simulation
- 4.7. Focus Peer Information
- 4.8. Query & Result Information
- 4.9. Single Step Progression
- 4.10. Advanced Controls
- 4.11. Legend
- 4.12. Keyboard Commands
The Network Viewer is the tool which achieves the main goal of our project, which is to visualize the peer-to-peer network. The Network Viewer's Input is an ODIN Network Activity File which was generated by the Pre-Processor. The Requirements for running the Network Viewer can be found in Chapter 1.
Here are instructions for compiling the Network Viewer:
1) Make sure you have Java installed and working (i.e. CLASSPATH is set correctly so you can compile from any directory). Certain features of the Java API we are using, such as priority queues in the pre-processor, require Java JDK 1.5. The Network Viewer may compile and run with earlier versions of the Java JDK, but this is untested.
2) Download the latest version of Processing. The Network Viewer was last tested using version 111. Download the "without java" version if you are using windows, so it will use your JDK instead of its own. Extract the contents to a folder called 'processing' (or whatever you choose).
3) Download the MyGUI toolkit . Version 010 is what we used. Extract the contents to the processing/libraries/MyGUI folder. Make sure the full path to the MyGUI JAR file is: processing/libraries/MyGUI/library/MyGUI.jar
4) You should now be able to open the graphviewer.pde file in Processing and run the program, or export the Network Viewer to a JAR file and applet.
![[Note]](images/tip.png) |
Note |
|---|---|
|
When the Network Viewer is compiled by Processing, the default ONA file (default.ona.gz) is placed inside the JAR file in a directory called 'data'. When the JAR file is executed as an applet, the ONA file inside the JAR will run. Deleting this file using a program that can edit ZIP files will allow you to store the default.ona.gz file outside of the JAR in a separate folder called 'data'. |
The primary way of executing the Network Viewer is to run the graphviewer.jar file as an application. Simply double click on the jar file in Windows or execute this command:
$ java -jar graphviewer.jar
When the Network Viewer is executed as an application, the Open ONA File Dialog will appear:
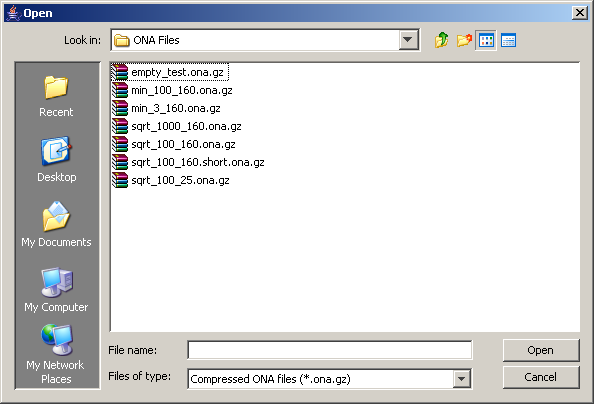
At this point it is possible to select the desired ONA file and press OK to start the visualization. Alternatively, pressing cancel will load the default bundled ONA file (see the note in section 4.1 for information on where this default ONA file resides).
![[Warning]](images/warning.png) |
Warning |
|---|---|
|
Because the file chooser is not bound to a parent Swing object, it has a tendency to open behind all other open windows. This must be taken into consideration when opening multiple instances of the Network Viewer. |
It is also possible to embed the Network Viewer in a webpage as a Java Applet. When the webpage is loaded, the applet executes and the data/default.ona.gz visualization file is run by the Network Viewer. Use this html to embed the Viewer as an applet:
	<applet code="graphviewer" archive="graphviewer.jar"
	width="1000" height="680" mayscript="true">
	<param name="image" value="loading.gif">
	<param name="boxmessage" value="Loading Network Viewer...">
	<param name="boxbgcolor" value="#FFFFFF">
	To view this content, you need to install Java 1.5 from
	<a href="http://java.sun.com/j2se/1.5.0/download.jsp">java.com</a>
	</applet>
An example of our Network Viewer running as an applet can be found on our Final Demo webpage.
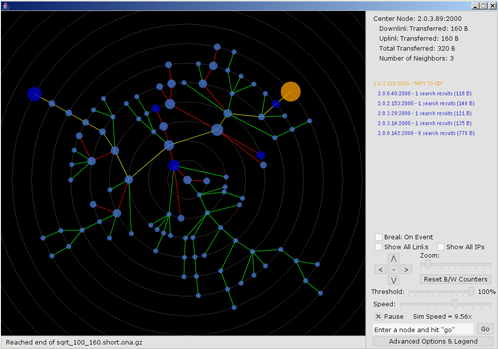
Listed here are all possible ways to control the look of the network view, which is the black section of the visualization tool that displays the actual network topology. Most of these controls can be accessed on the lower right portion of the program, or optionally with the keyboard commands.
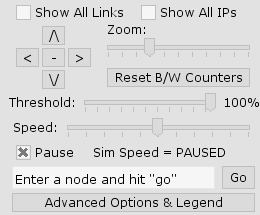
Show All Links - Checking this box will display all search connections in the graph. Unchecking this box will show one particular spanning tree of the undirected graph. Note that search result connections are always shown, but usually don't persist for long enough to notice unless using single step progression.
Zoom - This slider will increase or decrease the radius of the concentric circles, which has the effect of the network view zooming in and out.
Show All IPs - This will show all IP addresses next to their respective peers.
Scroll - These buttons have the same effect as using the arrow keys to move left, right, up and down.
Re-Center - This button puts the focus node back at the center of the display and resets the zoom to the default level.
Link Threshold - This slider determines which links are displayed. The default value, 100%, shows all links regardless of the number of bytes transferred. The links displayed with other link threshold values is best explained using the following example. Assume the link threshold is set to 50%. If 1 KiB has been transferred with the least used link, and 10 KiB have been transferred with the most used link, only links with a transfer counter of greater than or equal to [(10 KiB - 1 KiB) * 50%] + 1 KiB = 5.5 KiB will be displayed.
Peer Transition - By clicking on a particular node in the Network View, that node will be transitioned to the focus (center) position of the graph.
Search for Peer - Using the text input box that says "Enter a node and hit go", a particular peer's IP address can be searched for. If the Peer ID is found, that particular peer will be transitioned to the focus (center) portion of the graph. If it is not found, a message saying "Couldn't Find x" will be displayed. Partial text searches can be performed. For example, searching for "2.0.3." might return a result for "2.0.3.137:2000". If multiple matches exist, only the first one found will be returned.
Show Circles - This control is found in Advanced Options. This checkbox simply turns on and off the light colored concentric circles that give a visual cue as to how many hops away one node is from another in the spanning tree.
There are a few ways to control aspects of the simulation:
Simulation Speed - The Command Runner component of the Network Viewer uses the current framerate average in order to simulate the actual running time of the ODIN events as close as possible. Increasing or decreasing the simulation speed with the slider or keyboard commands will add a multiplier to this execution timer.
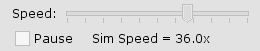
Pausing - Selecting the 'Pause' option will halt the execution of log events.

Resetting Data Transfer Counters - Pressing this button will reset data transfer counters for all links and peers in the graph to zero. All links will reset to their default state of green and all node sizes will reset to their original state.

Single Step Progression - this is covered in more detail in section 4.9.
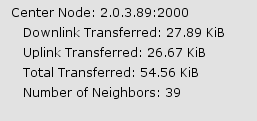
This portion of the display shows information about the focus peer, which is the node at the center of the graph. The focused peer can be changed by clicking on any node in the graph. Information about data sent, received, sent + received, and the number of neighbors is displayed. To reset all data transfer counters to zero, press the button that says "Reset B/W Counters."
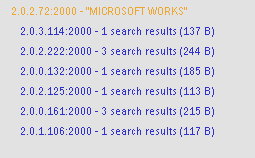
This portion of the display shows the most current query that is propagating through the network. The originator of the search term is colored orange, and has a corresponding node in the network view. All search results are displayed in dark blue. Also displayed is the size of the message in bytes and the comment string at the end of each log entry in the ONA file. For searches this comment is currently the term searched for, and for results the comment is the number of results. This can be changed as desired using our integrated ODIN code.
|
Note |
|---|---|
|
At present we only display the latest unique query and all search results appearing after it. When a new unique query is found this portion of the display is cleared to make room for the new query. An extension of this project would be to store a primary key (searchID) for all requests and results so that multiple queries could be handled at one time. |
It is possible to stop the progression of the simulation when a certain event occurs. This allows the commands in the ONA file to be executed one step at a time. For now we have predefined this event to be a unique search query. In order to enable break points, check this option:

The execution will proceed as normal until a break point is reached. When this happens execution will stop and "BREAK" will flash in the simulation speed indicator. Also two new controls will allow the stepping and resuming on the simulation:

When the 'step' button is pressed, the next command in the ONA file will be executed. The last command executed will be displayed at the bottom of the window. Furthermore, the peer(s) involved in the command will have their IP addresses automatically displayed in the network view. The simulation can be resumed again by pressing 'resume'.
|
Warning |
|---|---|
|
If "Break On Event" is still checked when the simulation is resumed, it may quickly stop again if the simulation speed is set to a high value. In order to avoid this behavior, uncheck "Break On Event" before pushing 'resume'. |
The advanced controls can be accessed from main view by clicking on the button that says "Advanced View & Legend."
Here is a description of each control's function:
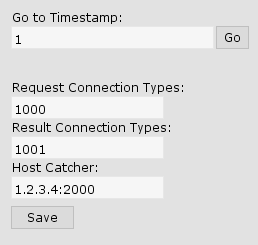
Go to Timestamp - Seeks to a particular timestamp in the ONA file. The first timestamp is the ONA file is displayed by default inside the input box. If the particular timestamp entered is not found, the simulation will seek to the nearest timestamp that is greater than the one entered. Note that when the timestamp is reached, the execution breaks to allow single step progression. Normal simulation execution can be started again by pressing 'resume'.
Request Connection Types - The number entered here will be referenced by all functions of the Network Viewer used for building and displaying the graph. This number must match the value inside the ONA file for search connections.
Result Connection Types - The number entered here will be referenced by all functions of the Network Viewer used for building and displaying the graph. This number must match the value inside the ONA file for result connections.
Host Catcher - Since queries related to the Host Catcher were deemed uninteresting to visualize, all commands which have a Peer ID matching the value here are ignored.
|
Note |
|---|---|
|
For the ONA files we used for testing, the Host Catcher setting was redundant. This is because there were no Host Catcher related connections that used the 1000 or 1001 connection type. However, we included this feature for future unforeseen use. Also note that the Request Connection Type and Result Connection Type settings can only take in one value. It may be useful for future extensions of this project to accept a comma separated list of valid connection types. These would probably have to be mapped into a hash table upon 'save' in order to not slow down the Network Viewer, since these values are referenced for all drawn links and peers. |
The legend is a accessible from the main view by clicking on the button that says "Advanced View & Legend."
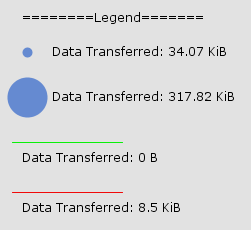
This dynamically updating legend will show the minimum and maximum representations of link and peer data transfer in the network view. Link colors refer to total data transfer over Request Connections. Node sizes refer to all data (Request and Result) received and sent from each peer. Because search result links don't persist long enough, they were not included in the dynamic legend. However, it is still possible to obtain this information from the Query & Result Information display.
Most of the main GUI widget controls are also binded to keyboard shortcuts. Here is a listing of all keyboard commands:
Arrow Keys - Scroll the view of the network up, down, left, and right.
+ - Zoom in the network view.
- - Zoom out the network view.
L - Toggle 'Show All Links'.
Z - Decrease simulation speed.
X - Increase simulation speed.
M - Decrease link threshold.
N - Increase link threshold.
C - Toggle 'Show Circles'.
O - Center network view (with default zoom level).
P - Pause / Unpause the simulation.
I - Toggle 'Show All IPs'.
R - Reset Bandwidth Counters.